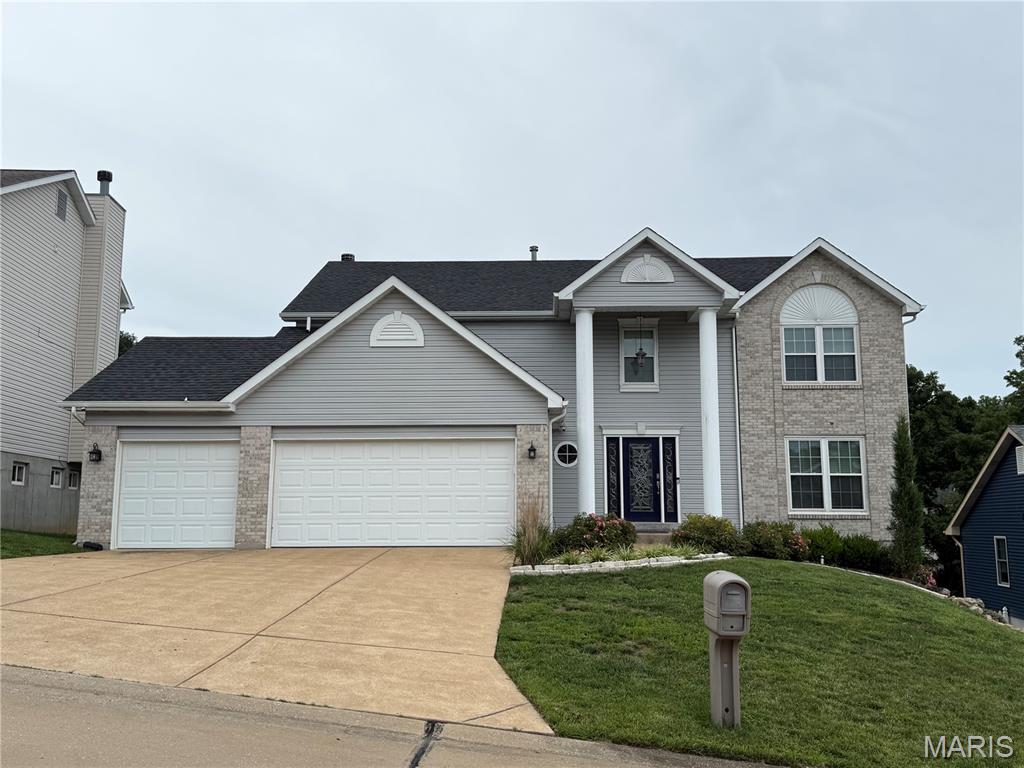
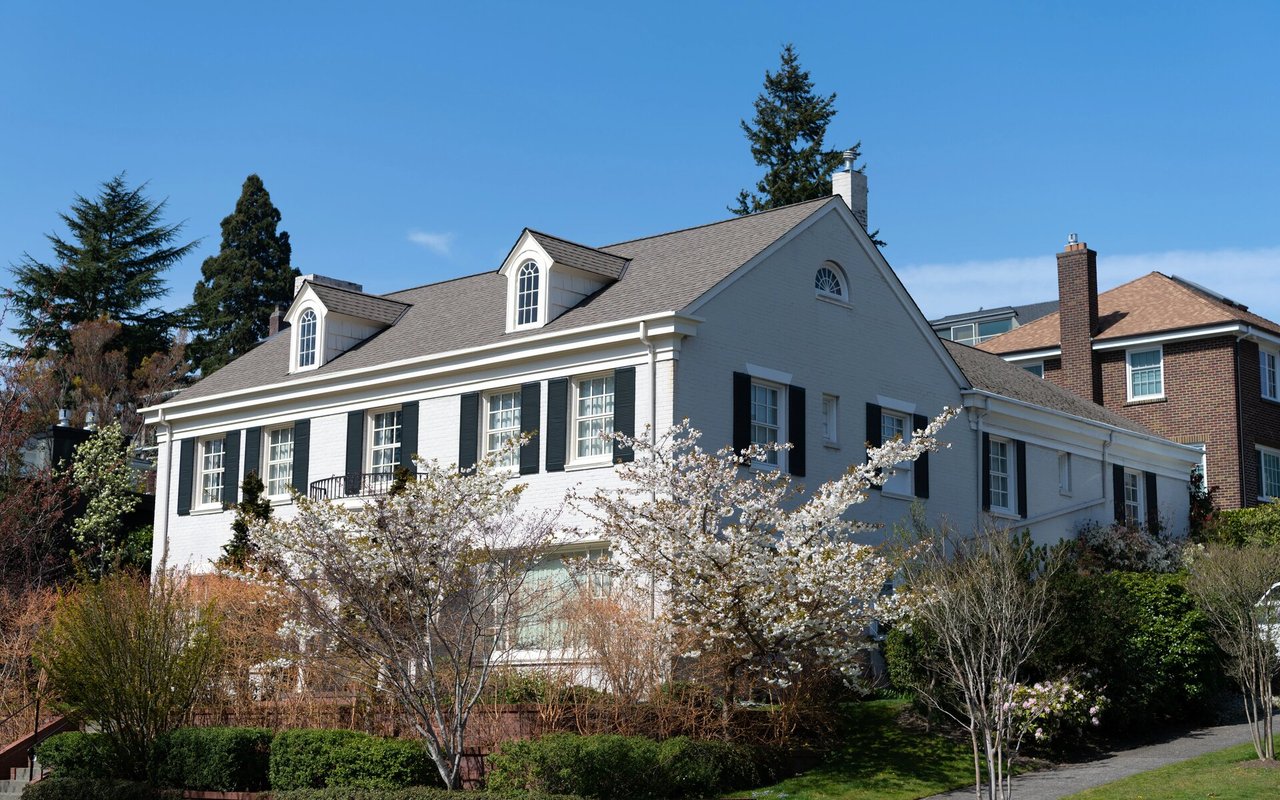
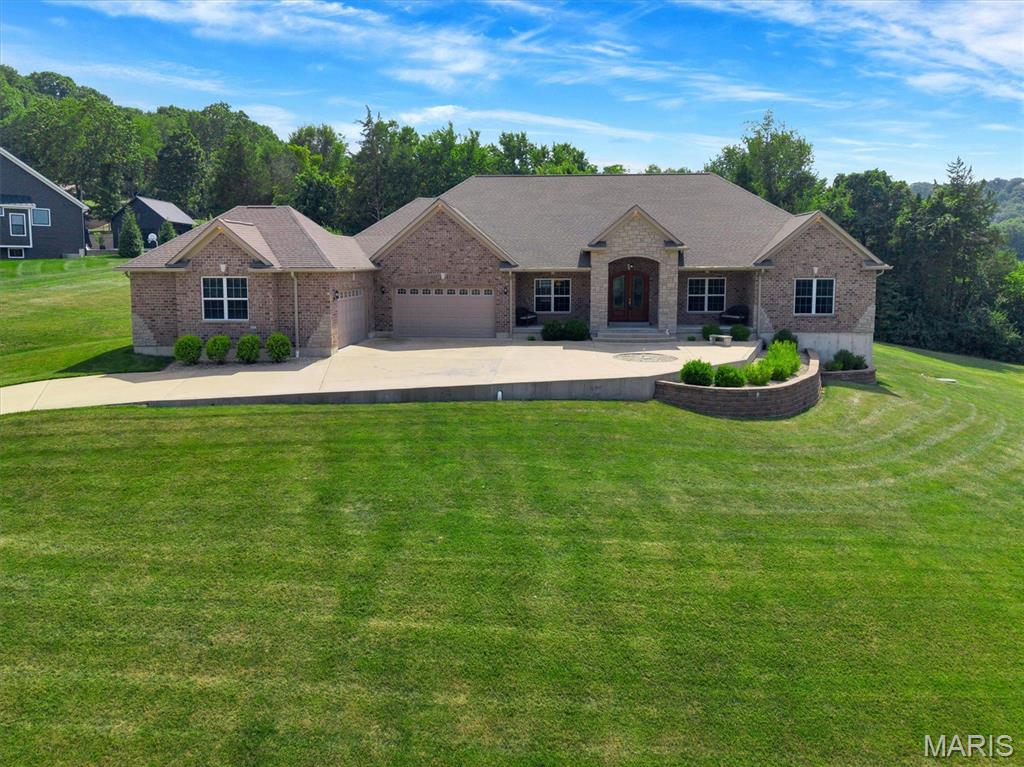
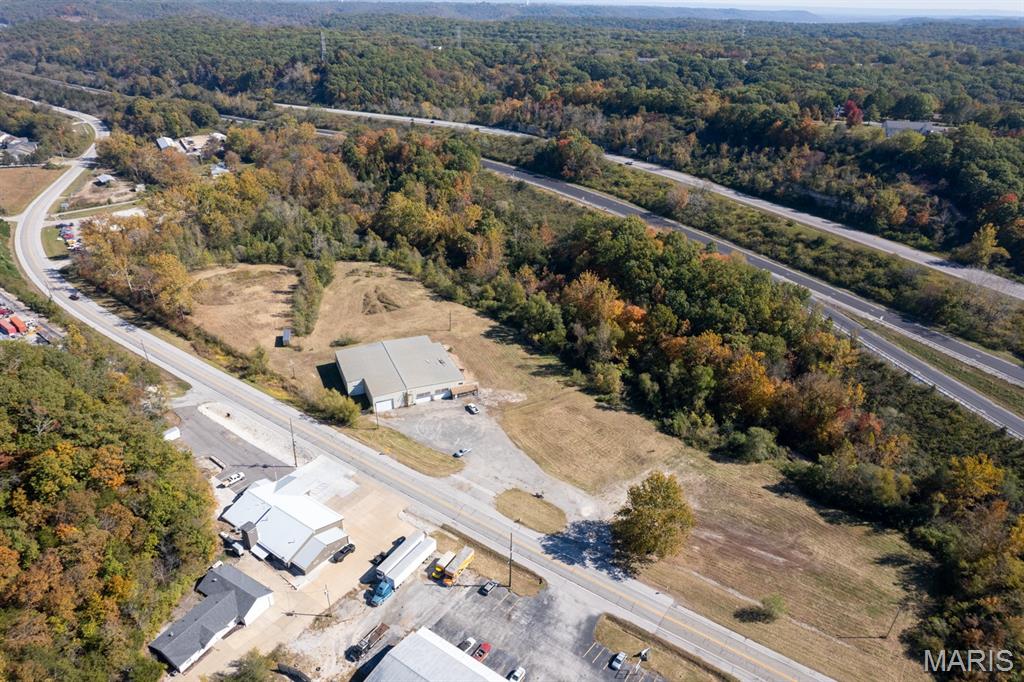
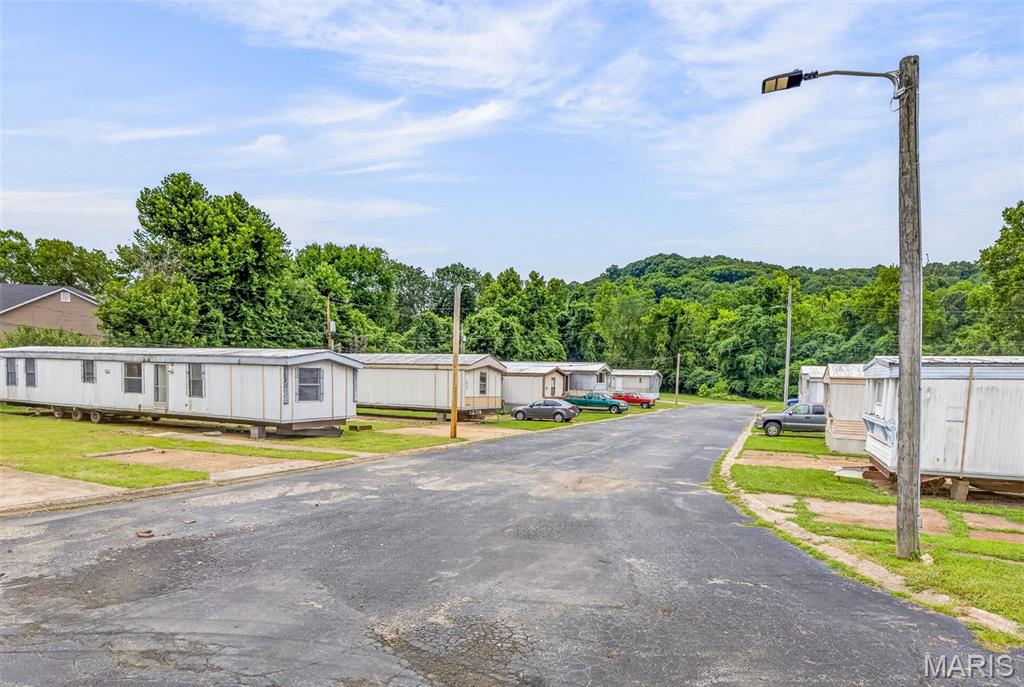
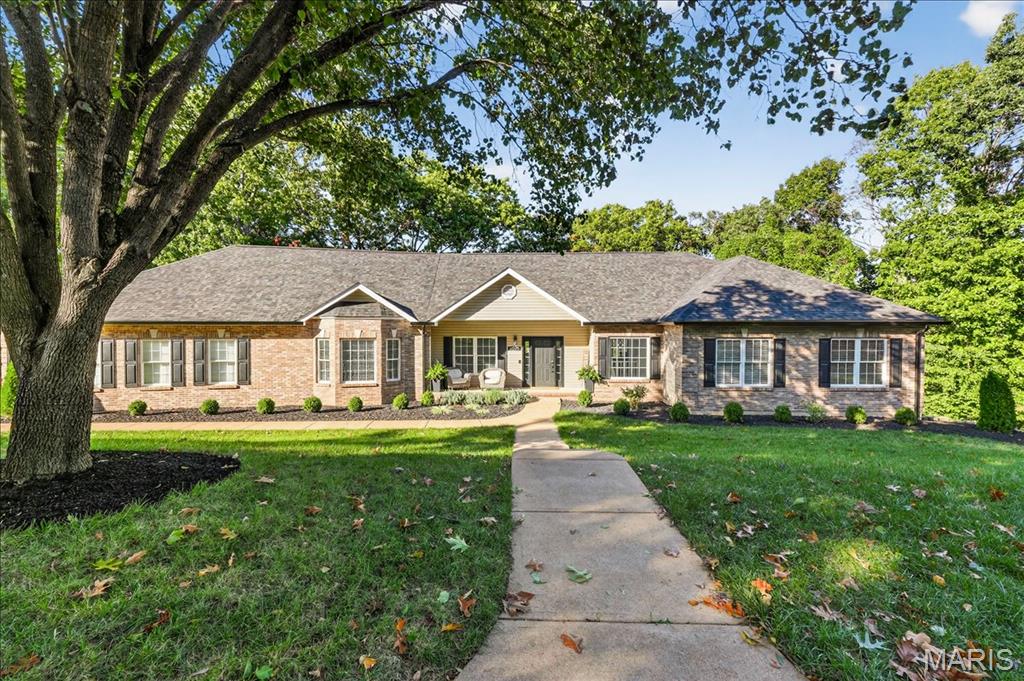
Nestled along the rolling hills and scenic bluffs of the Meramec River, Imperial offers a peaceful escape where rustic charm meets modern suburban comfort. Residents enjoy a slower pace of life, with weekends spent exploring the ancient history at Mastodon State Historic Site or enjoying the lush, wooded landscapes that define the area. With its spacious homesites, community-focused atmosphere, and easy access to outdoor adventure, Imperial is the perfect retreat for those seeking a quiet, scenic place to call home just south of the city.
28,741 people live in Imperial, where the median age is 38.9 and the average individual income is $41,050. Data provided by the U.S. Census Bureau.
Total Population
Median Age
Population Density Population Density This is the number of people per square mile in a neighborhood.
Average individual Income
There's plenty to do around Imperial, including shopping, dining, nightlife, parks, and more. Data provided by Walk Score and Yelp.
Explore popular things to do in the area, including Baked & Brewed, St. Louis Kolache, and Imperial Produce.
| Name | Category | Distance | Reviews |
Ratings by
Yelp
|
|---|---|---|---|---|
| Dining | 3.49 miles | 7 reviews | 5/5 stars | |
| Dining | 4.71 miles | 9 reviews | 4.9/5 stars | |
| Dining · $ | 3.42 miles | 11 reviews | 4.8/5 stars | |
| Active | 4.77 miles | 10 reviews | 5/5 stars | |
| Beauty | 2.86 miles | 5 reviews | 5/5 stars | |
| Beauty | 2.86 miles | 10 reviews | 5/5 stars | |
|
|
||||
|
|
||||
|
|
||||
|
|
||||
|
|
||||
|
|
Imperial has 10,452 households, with an average household size of 2.75. Data provided by the U.S. Census Bureau. Here’s what the people living in Imperial do for work — and how long it takes them to get there. Data provided by the U.S. Census Bureau. 28,741 people call Imperial home. The population density is 868.53 and the largest age group is Data provided by the U.S. Census Bureau.
Total Population
Population Density Population Density This is the number of people per square mile in a neighborhood.
Median Age
Men vs Women
Population by Age Group
0-9 Years
10-17 Years
18-24 Years
25-64 Years
65-74 Years
75+ Years
Education Level
Total Households
Average Household Size
Average individual Income
Households with Children
With Children:
Without Children:
Marital Status
Blue vs White Collar Workers
Blue Collar:
White Collar:
Get assistance in determining current property value, crafting a competitive offer, writing and negotiating a contract, and much more. Contact me today.